Advanced Crypto Analysis
Analyze your risks, compare your performance, and get insights tailored to your profile
Our advanced crypto analysis module gives you a clear and in-depth view of your investments. Take advantage of powerful tools to assess your risks, compare your performance, and optimize your strategy.

Investor Profile Analysis
When you sign up, a complete quiz analyzes your investor personality and categorizes you into one of several profiles: visionary, speculator, analyst, enthusiast, or conservative. You’ll discover your investment style, its strengths, areas for improvement, and you can compare your profile with other members. Each profile is detailed in the app to help you better understand your choices and fine-tune your strategy.
Risk Analysis
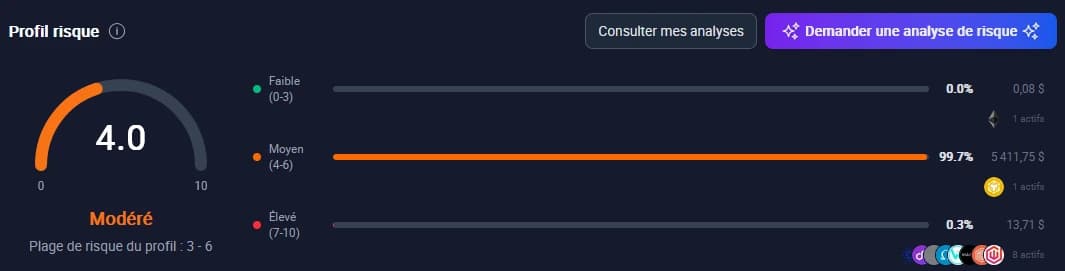
We automatically categorize each of your assets according to its risk level: low, moderate, or high. Your exposure breakdown is shown in your dashboard, with totals per category and a direct comparison with the risk level associated with your investor profile. This helps you see if your management aligns with your risk tolerance.
Performance Analysis
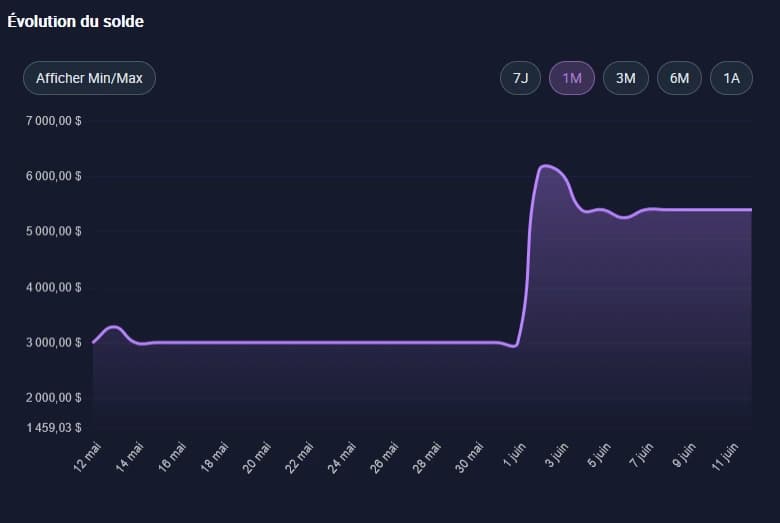
Our system automatically calculates your performance: see your gains or losses at a glance, in absolute value ($) and percentage, for each asset and each portfolio.
The unrealized PnL (profit & loss) of your positions is clearly displayed against your cost basis, to help you manage your strategy and make informed decisions.

Crypto News Analysis
Stay informed about market trends and sentiment on your assets, tokens you hold, or the crypto market in general.
Discover the most mentioned tokens in the news, those trending or making buzz, and adjust your strategy according to market movements.
Crypto Market Analysis
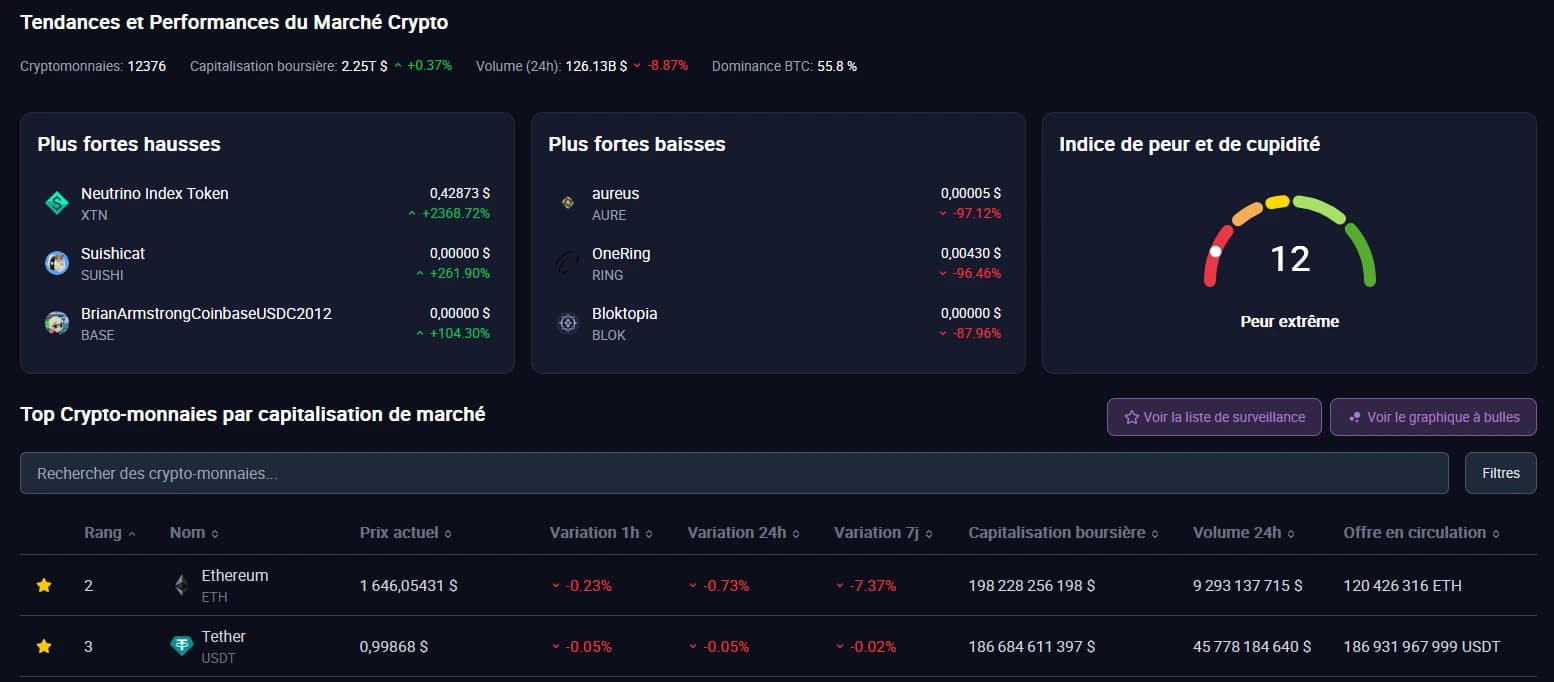
Access a complete crypto market overview: top cryptos, biggest drops, current trends, and simple charts for a clear and quick view of market changes.
Perfect for spotting opportunities and anticipating major moves.
Benefits of Advanced Crypto Analysis
- Easier decision-making with reliable, visual data
- Continuous optimization of your investment strategy
- Market anticipation through active monitoring
- Understand market dynamics to invest smarter
- Better self-awareness as an investor, managing emotions and biases effectively
How does advanced crypto portfolio analysis work?
- 01
Set your investor profile
The quiz you take at sign-up matches your style to one of five profiles. That profile then becomes the benchmark for checking whether your portfolio fits your risk tolerance.
- 02
Let Exceefy rank your assets
Every coin in your portfolio gets a low, moderate or high risk level. There is nothing to calculate: the ranking updates whenever you add or remove an asset.
- 03
Read your actual exposure
The dashboard shows the share of each risk level and compares it with what your profile would suggest. A large gap is a signal that your allocation may deserve a second look.
- 04
Cross-check with performance and news
Put these figures side by side with your unrealized PnL per asset and the news on the tokens you hold. You get a clearer picture of where your gains, losses and exposure come from.
When should you use advanced crypto analysis?
The cautious investor holding too many altcoins
You saw yourself as conservative, but a string of impulse buys pumped up your small caps. The risk analysis shows in black and white how much of your portfolio is actually high risk.
The investor who wants to understand performance
Your portfolio is up, but you can't tell which assets are driving the result. The per-asset breakdown, in dollars and percent, reveals the positions pulling performance up and those dragging it down.
The member looking for an outside view
You feel too close to your positions to judge them objectively. On the Max plan, AI risk analysis gives you an additional reading of your portfolio, while the final decision stays yours.
Which plan includes advanced analysis?
Portfolio risk calculation is included from the Free plan, along with general news and news statistics. The Plus plan (€5 per month) unlocks the detailed risk breakdown, the calculator and per-token news. The Max plan (€15 per month) adds AI risk analysis, AI news and the activity report.
Frequently asked questions about advanced crypto analysis
Get Started Now
Sign up for free and discover how Exceefy can transform your crypto portfolio tracking experience.